Process performance management and financial control of key performance indicators as shown in an explorative study of national and international companies
Author
Bettina C.K. Binder
Abstract
Process-oriented performance management in international business is a highly debated topic. One question repeatedly raised both in theory and practice is whether process-oriented performance management in national and international firms has to be structured (Tsai and Hung, 2009; Bourne et al., 2003). Moreover, it can be questioned whether the results of key performance indicators measured through financial control in national and international companies are really the same. In order to answer this question, an explorative study (using questionnaires) was conducted by Pforzheim University in the fourth quarter of 2014, in which 26 industrial partners participated. The article, therefore, focuses on the results of the survey which shows what key performance indicators are used (or not used at all) both in national and international companies. The main contribution of this article is the fact that, it shows how the management of key performance indicators in national and international business looks like in reality.
Keywords
- Performance management
- Key performance indicators
- Financial performance measures
- Non-financial performance measures
- National and international companies
1. Process-oriented performance management: introduction
The internal and external accounting of a company should provide, among other things, information in terms of key performance indicators (KPIs) for different audiences. These are measured qualitatively and quantitatively and are hereafter defined as performance measures. Managers and executives in a company as well as internal and external investors make their decisions based on these performance measures (Kaplan and Norton, 2001). If the KPIs are measured on the basis of processes, then a process-oriented performance management system is in use (Bourne, 2000).
It is interesting to compare how many non-financial performance measures or financial performance measures are evaluated in the individual companies (Franco-Santos et al., 2007). Businesses today often calculate the company’s value in order to estimate the intrinsic value of a company. These values typically contain process orientated key data, which makes up a substantial aspect of this article.
In order to determine the substantial key data which is used in financial control in the form of KPIs, an anonymized online survey was conducted in the fourth quarter of 2014 at the Pforzheim University in which 26 industrial partners participated. Many studies have already been done on KPIs. However, no study has been done, unlike the one on this article that compares process orientated performance measures of national and international companies and highlights their commonalities and differences. The study was methodically done by consulting approx. 250 performance measures that are either in use or not in use at all in national and international companies. Subsequently, this was followed by statistical analyses in order to determine the effects of several influential factors on the management of KPIs in a company.
1.1. Performance management and performance measurement: commonalities and differences
Performance management not only focuses on individual business units but also on the management of the entire company by managers and executives (Krause, 2006).
By optimizing operational processes of the entire company, an operational process oriented performance management is achieved (Bititci et al., 2012).
Besides the measurability of KPIs, performance management also considers organizational aspects, for instance, the assignability of resources on different organizational levels, learning effects and employee motivation (Richard et al., 2009). These factors are important in the constellation of the performance measures because they reveal whether the KPIs are simple, standardized or complex and also show the degree of complexity in their calculation (Williams, 2002).
Performance measurement serves as a database for a balanced activity recording through financial control (Gleich, 2011). The objective is obtaining a systematic, multidimensional performance tracking, management and control for different application objects (Bourne, 2001) or on different levels of performance (e.g. employees, teams, departments, processes etc.) with the aim of a continuous improvement of individual company’s performance (Taticchi, Tonelli and Cagnazzo, 2010).
Folan and Browne (2005) focus on the more comprehensive term ‘performance management’ which also includes other management aspects besides measurability. This article will particularly look at performance measurement aspects as a substantial component of performance management used by controllers in a performance measurement system, while the KPIs will be also briefly explained in the following passages.
1.2. Goals and tasks of a process oriented performance management
This article is aimed at achieving a long term performance excellence by measuring the process oriented performance measures and increasing the operational results of a company with an optimal process performance management.
Below are four substantial tasks, which should be fulfilled by process oriented performance measures based on the above study:
- Is process orientation guaranteed?
Particularly in global companies, a worldwide standardization of the processes should be aspired so as to, ideally, achieve a process oriented key data that should be uniformly defined and measured globally. This requires, among other things, existing processes and their measurability with the help of process oriented performance measures (Binder, 2003).
- Are there approaches to management available?
Performance management mainly targets the holistic management of a company. The goal of an efficient management of an organization is, therefore, to manage the performance provision using performance measures (Demartini, 2014). - Are non-financial aspects integrated in the performance indicators?
Is it only the financial performance measures that are evaluated or also the non-financials? Many publications assume that there is a significant influence of non-financial performance measures on a company’s success (Martín-de-Castro et al., 2011).
- Does measurability in national and international companies exist?
It is decisive to have measurability of performance measures not only on the national level of a company, but also on its international operations, if a standardized regulation of key indicators in financial control is to be achieved in order to have uniform control (Neely, 2005).
2. The explorative study based on 26 industrial partners
A research on process performance management and process performance measurement (PPM) models in the literature distinguished between the following concepts:
- Financial and non-financial PPM concepts (De Toni and Tonchia, 2001). Here KPIs such as the earnings before taxes (EBT), which is a financial KPI, or the number of claims, or the order process time, which are qualitative measurements, thus non-financial KPIs, can be found.
- Strategic and operational PPM concepts (Hoque and James, 2000). These are aimed at creating the right strategy, and derived from it achieving the highest company profit. One of the most famous concepts in this category is the Balanced Scorecard (BSC), designed by Kaplan and Norton in the 1990s. Operational performance measurements work with more detailed KPIs, such as costs of order processing, and they are generally more quantifiable.
- Operation oriented and structure oriented PPM concepts (Neely and Adams, 2001). Operation oriented PPM concepts focus on the processes’ stages and their KPIs, while structure oriented PPM concepts go into more detail with regard to company’s organizational structure, analysing for example the function of management control.
- Achievement levels and receiver-group-oriented PPM concepts (Purbey, Mukherjee and Bhar, 2007). The PPM concepts included in this category, such as cash flow or KPIS of certain receiver groups (employees, management, etc.) often use relatively individualized KPIs.
- Industry related PPM concepts (De Vries and Margaret, 2003). These exist in various industries and branches (metal finishing industry, freight transportation, etc.) and process based KPIs are often integrated and measured in this category.
All five kind of concepts can exist parallel to one another. For instance, a strategic performance management concept for a telecommunications company can be reflected through the financial performance measures. Moreover, the receivers of the key performance information of the individual achievement levels of the company can be represented in teams or departments.
Due to the general misrepresentation of the internationalization degree of performance management concepts, an explorative study was conducted, which should bring light on the performance measures that are used in national and international industrial companies.
The 26 industrial enterprises were carefully selected, they are large companies (with several thousand employees), whose parent company is located in Germany, but have one or more subsidiaries abroad. Moreover, all companies are industrial firms active in different sectors such as food and household products, industrial goods and automotive.
2.1. Application
Not all performance measures in a company are recorded or measured, nor is a standardized collection on a monthly basis done. Thus, the advantage of using a questionnaire is clear since it is easy to show with the help of a questionnaire, whether an industrial company measures the key performance figures on the national level – German parent company- and whether the same figure is used within the international operations or whether the data is recorded at all. Thanks to the greater significance of information and communication technology today, almost any performance indicator can be proven arithmetically (Gladen, 2008). The disadvantage of using a questionnaire, however, is that some types of performance measures such as innovative performance measures (e.g. KPIs for scenario technology) cannot be measured in detail (Kennerley and Neely, 2003). Another example of an innovative performance measure that cannot be measured is the company’s value. This is due to missing value drivers or international procedural input data (Lehtinen and Ahola, 2010).
2.2. Survey
The survey included about 250 performance measures in 9 functional areas. These are: strategic and operational planning, R&D control, logistic control, production control, sales control, cost accounting and calculation, project and investment control and company and shareholding control. As the planning process in a company covers all functional areas and it contains a high number of KPIs which are measurable for most companies, the author chose to concentrate on the functional area strategic and operational planning.
The following illustration shows the structure of the anonymized questionnaire for the area strategic and operational planning:
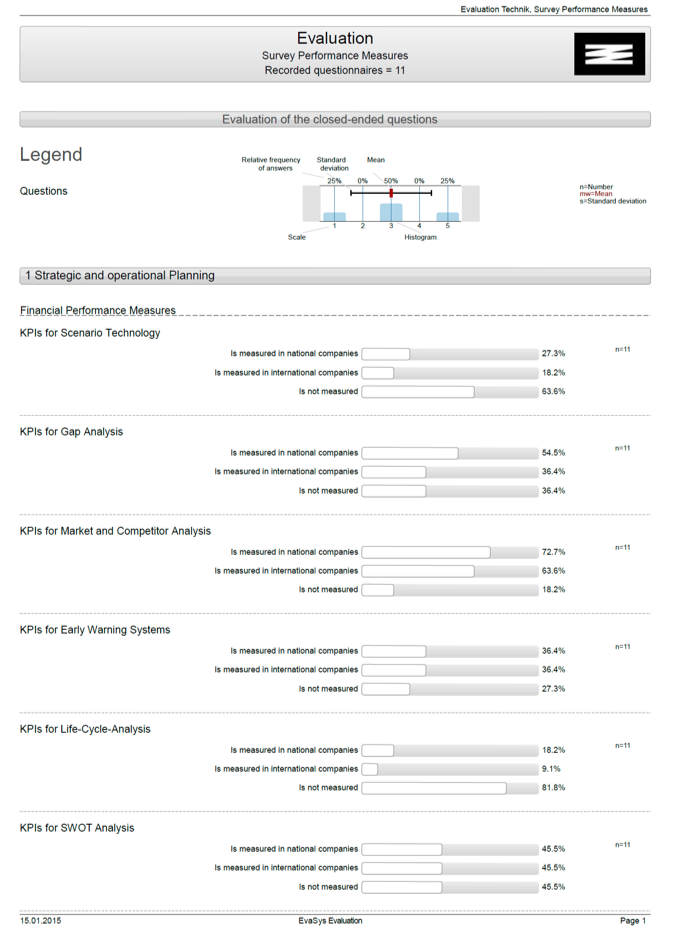
Figure 1. Anonymized questionnaire on process-oriented performance management.
The return ratio was 42% i.e. 11 participants out of 26 responded. Moreover, there could be multiple answers to one question and therefore the sum of the answers becomes greater than 100%.
2.3. Financial and non-financial performance measures
The following financial performance measures were, for instance, polled in the functional area strategic and operational planning:
- KPIs for strategic gap analysis
- KPIs for market and competitor analysis
- KPIs for early warning systems
- KPIs for life cycle analysis
- KPIs for SWOT analysis
- KPIs for portfolio analysis
- KPIs for balanced scorecard
- KPIs for value analysis
- KPIs for continuous planning
- KPIs for forecasting
- KPIs for better budgeting
- KPIs for advanced budgeting
- KPIs for beyond budgeting
- KPIs for annual planning
- KPIs for quarterly planning
- KPIs for monthly planning
- KPIs for benchmarking
- KPIs for target costing
- KPIs for process analysis
- KPIs for value based management
- KPIs for core competency approach
- KPIs for deviation analysis
(plan/actual/target)
- KPIs for deviation analysis
(planning/target agreement)
- KPIs for investment projects
- KPIs for cost category planning
- KPIs for cost objective planning
- KPIs for risk planning
The list shows that the performance measures were not broken down into a mathematical formula because this would mean a bigger effort in an already complicated and extensive questionnaire with approx. 250 performance measures. Moreover, the KPIs, especially those in the strategic and operational planning, are closely connected with the instruments that were already of great importance to high-level personnel in financial control (Otley, 2007).
The surveyed non-financial performance measures for the functional area strategic and operational planning were:
- Strategic workflows/p.a.
- Strategic projects/p.a.
- Applied strategic tools/p.a.
- Applied strategic IT-solutions/p.a.
- Duration of planning period
- Capacity planning
- Key account customer planning
- New customer planning
- Number of consolidation workflows
3. Results of the explorative study in national and international companies
The results of the survey in the nine functional areas have confirmed our prior expectations to a large extent: while in the following nine functional areas rather operational performance measures with their associated instruments were evaluated, strategic performance measures and their instruments are, generally speaking, still missing in many companies. Since all the polled companies have their parent company in Germany and own international daughter companies abroad, the survey showed that the performance measures of the parent company were more likely to be measured than that of their international subsidiaries. This means that often no special international performance measures for foreign held companies were used. This fulfilled the expectation of the study that financial control and its key indicators orient themselves particularly to the existing performance measures of the national companies and take over these control figures in the long run for the international holdings alike.
3.1. Results within the functional area strategic & operational planning
The survey showed that newer instruments like the scenario technology, life cycle analysis and beyond budgeting concepts in the functional area strategic & operational planning (Aureli, 2010) were not used in most companies, thus no performance measures could be evaluated. This also applied to the core competence approach, value based management, target costing and risk management.
As expected, national companies had operational numbers-oriented instruments in use, for instance, planning data for annual and continuous planning, forecast, quarterly and monthly planning and the deviation analysis as well as cost category, cost centers and cost objective accounting. The implementation of such detailed KPIs can be considered typical for German companies. Moreover, it is interesting to note that gap analysis, portfolio and competition analyses, benchmarking and process key indicators were also predominantly used in German companies. Prior to the study, it was assumed that common global strategic instruments and their performance measures were existent in international companies (Jusoh, Ibrahim and Zainuddin, 2008).
It was, however, unexpected to find the use of a small percentage of instruments like value analysis, which incorporates target costing and the value based management, since these are specifically global instruments as can be derived from their name. Moreover, there were no particular instruments and queried performance measures that occur only in international companies.
Above all, financial performance measures are dominant in the functional area of strategic and operational planning. Non-financial performance measures, which are commonly not measured, include the number of workflows, the number of strategic instruments, applied IT-solutions and the number of consolidation workflows.
Least of all, the number of strategic projects, the duration of the planning period, resources in strategic planning are predominantly measured in national companies. The most remarkable here is the measured performance indicator of the number of key account customers and the new customers. The number of consolidation workflow plays no role whatsoever in national and international companies. For the international companies, however, only the non-financial performance measures like the duration of the planning period or the number of key account customers and new customers are relevant for decision-making.
Instruments which are similarly used in national as well as international companies are as per their English definition the early warning systems, i.e. SWOT analysis and the balanced scorecard.
The above evaluation of the functional area strategic and operational planning clearly shows the need of consulting in companies. It also points out which instruments and performance measures that are essential for an effective management in financial control are often still missing (Chow and Van Der Stede, 2006).
The following table summarizes the main results for the functional area strategic and operational planning.
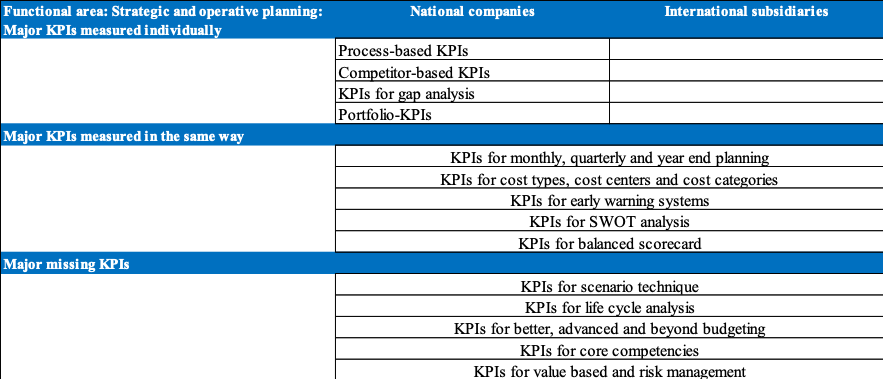
Table 1. Major indicators of the functional area strategic and operational planning
3.2. Management reporting
The functional area management reporting is regarded as a cross section function and multiple key numbers are shown and measured in individual reports. Therefore, the functional areas R&D control, logistics, production and sale control were subordinated to management reporting with the assumption that the reports with the following performance measures are proven and measured.
It is however surprising that in the functional area management reporting of the cash flow per employee and the key number of the shareholder value for all three methods of discounted cash flow, cash flow return on investment and economic value added are not measured (36%). This is contrary to numerous publications as precisely these innovative key numbers are not used in most companies (55%) as the following illustration shows:
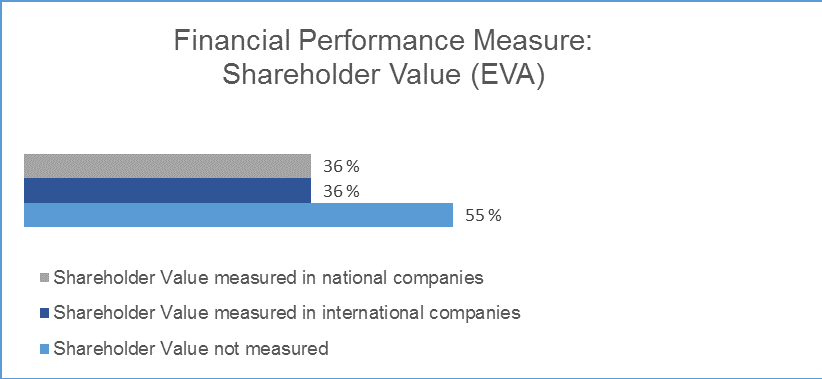
Figure 2. Measurement of the key indicator shareholder value in national and International companies.
EBIT and sales key numbers like sales per customer, sales per employee EBIT, EBITA and EBITDA are predominantly measured in national companies (85%). In international companies only 67% use these figures. This is again surprising since these numbers are per definition international key indicators.
Moreover, return key numbers like return on capital employed, return on investment, equity, total capital and turnover profitability are predominantly measured in national companies (82%). In comparison, only 65 % of the international companies use return key numbers. Cash flow is definitely regarded as important in national companies (100%). As expected, performance measures like the liquidity ratio of the first, second and third degree as well as key numbers of the balance sheet like asset cover ratio and consolidated income statement in sales and cost of production method are rather measured in national than in international companies. One possible explanation for this is the availability of data, as in national companies the data is saved in the systems of the companies and the KPIs can be calculated online in time.
The key indicator Working Capital is similarly measured in national and international companies, even though it is per definition an international control key indicator. The measurement of different types of investments (total) or replacement, rationalization and extension investments is also dominant in national companies (100%).
There are no performance indicators that occur only in international companies. In both national and international companies, a shareholder value measurement using the discounted cash flow and economic value added procedure was made, with 36% in each case.
Financial performance measures are dominant in the functional area management reporting and non-financial performance measures such as number of pages of the monthly, quarterly and annual report are not measured; however, the duration up to the dispatch of the monthly, quarterly and annual report in working days is considered. Non-financial personnel key indicators like the employee fluctuation, resources in the form of full-time-equivalents (FTEs) in management reporting and within a capacity planning are predominantly measured in national companies.
The determination of the indicators cash-flow/employee and the shareholder value following e.g. the cash flow return on investment methodology does not take place. Instead, traditional sales results, returns and investment ratios are measured more in national companies. This also applies to the cash flow and working capital, which are rather international figures. This fact can also be connected to the fact that, nowadays, global key figures like the working capital in many companies are commonly measured at the national level, or rather these key indicators have been newly adapted at the national level for measurement. As it can be seen in table 2, there are no key figures that have emerged only in reports of international companies and are absent at the national level.
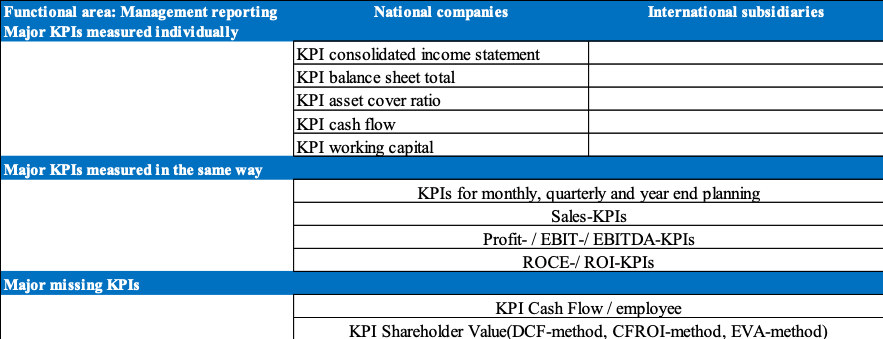
Table 2. Major indicators of the functional area management reporting
3.2.1 Management reporting R&D control
Although target costing KPIs in the functional area R&D were classified in advance by the companies in the questionnaire to be relevant for international companies with a 36% score, they were in the end not measured. Just a few performance measures are measured within the life cycle costing. Many R&D indicators such as the development rate and the number of R&D projects for basic research and new product development or for product development are hardly used for the measurement. Rarely used are also the number of R&D applications, the approved R&D requests of successful completed R&D projects and the resources expenditure within a R&D project. Likewise, process innovations are not measured as opposed to product innovations.
Typically, most remaining R&D data are measured in national companies (Adams, Bessant and Phelps, 2006). These are the R&D costs in the plan, actual and forecast value (because costs are the easiest KPIs which can be measured), the R&D costs in % of sales and the number of R&D projects. The number of product innovations, as opposed to process innovations, are only measured in national companies (Fitzgerald, 2007).
The indicator time to market was measured both in national and international companies, each with a 55% score.
In R&D control area many qualitative performance measures which are non-financial due to the implemented principles and application-oriented R&D are calculated (Bourne et al., 2000). However, only few qualitative performance measures were actually measured.
The few financial performance measures such as R&D costs in R&D control are measured especially in national companies (91%). Non-financial performance measures are often not measured. What stands out in the functional area R&D control is that, least of all, product innovations and schedule variances are measured in national companies and a capacity planning is made. The average resource requirements for an R&D project in FTEs are mainly measured in national companies.
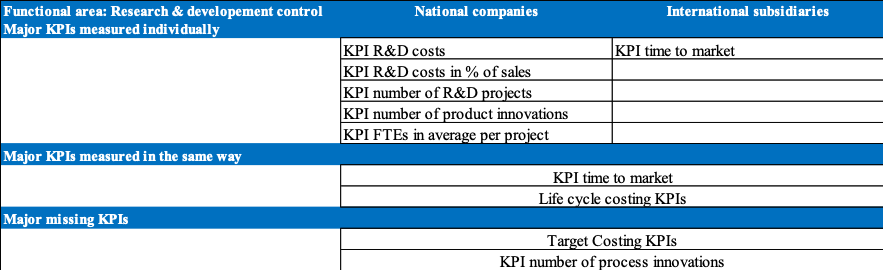
Table 3. Major indicators of the functional area research and development control
3.2.2 Management reporting: logistics control
Major non-financial KPIs such as the average distance between the storage and the customer are not measured.
Most of the logistics data are measured in national companies. These are financial performance measures such as purchase costs, storage costs and transport costs – each in plan, actual and forecast value because these KPIs show well-defined measures that can be easily calculated. The average stock in kEUR is also measured in national companies. 80% of these performance measures are used for evaluation in national companies. Purchasing costs in plan with a 100% score counts as the most important performance measure in logistics control in national companies.
The purchase costs in plan in international companies are seen as an important performance measure, however, its importance is significantly lower than at the national level. The other performance indicators in logistics control, which occur particularly in reports for international companies, play a rather subordinate role.
One performance measure in the logistics control that is measured with the same intensity at the national and international levels is the backlog. It outlines not in-time delivered commodity (both national and international companies recorded 55% in backlog).
In logistics control section many qualitative performance measures are determined by the procurement, storage and transport activities and their duration (Chan and Qi, 2003). They are usually non-financial. The following qualitative measures of performance are measured: backlog, number of suppliers, scrap rate, duration of customer order processing, number of shipments, average order size, turnover rate and shipping rate. The performance measure turnover rate plays an important role with an 82% score in national companies as well as the rework ratio. The average cash conversion cycle, the number of storage sites and the number of consignment warehouse locations are barely measured.
In the logistics control only a few financial performance measures such as purchase, storage and transport costs are measured particularly in national companies. Table 4 gives an overview of the functional area logistic control.
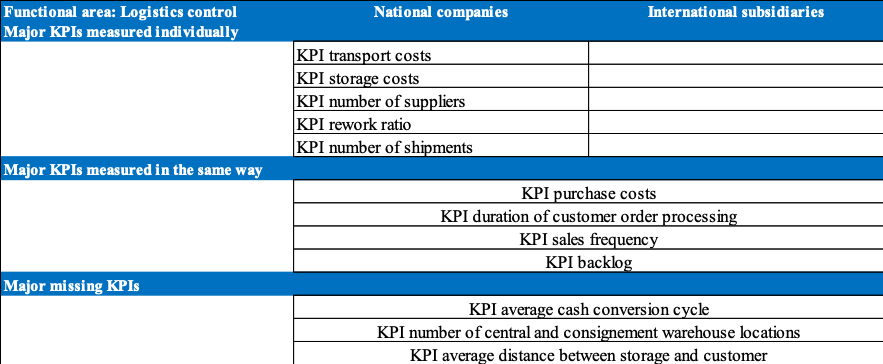
Table 4. Major indicators of the functional area logistics control
3.2.3 Management reporting production control
The following KPIs were not measured: KPIs for product and process benchmarking (this is surprising since benchmarking and its key data are noted as available in national companies in the questionnaire before – but were left unmeasured), KPIs for decentralized storage and KPIs for technology portfolio analysis. Similarly, KPIs for process cost calculation and KPIs for risk analysis were not measured though it was indicated prior to the survey that data were available, e.g. the later were with a 46% score available both in national and international companies. The degree of asset depreciation was also not measured. It is rather unusual that KPIs for financial statements in production were not consulted for measurement because these KPIs are usually well-defined and often used for measurement.
However, it was seen that financial performance measures were consulted in national companies – in the production area they are the clearest and well-defined KPIs. These are production costs in plan, actual and forecast. Not evident were own performance indicators used in production control, which occur particularly in reports for international companies.
The following performance measures in production control were calculated both in national and international companies: the number of in-time deliveries, the setup time per machine and the production quality – all measured in % (return quantity/production quantity).
Many qualitative performance measures in production control area are calculated but are often not measured. The following non-financial performance measures are used in measurements in national companies: turn-around times for production orders, downtimes per machine, utilization rate per machine, KPIs for central storage and rate of utilization and indicators for capacity planning.
All financial performance measures are consulted for measurements in production control but one: production costs. However, many non-financial performance measures are not used at all. Only three non-financial performance measures play an important role on the national and international level: the number in-time deliveries, the setup time per machine and the production quality. All are measured in % (goods return quantity/production quantity). This analysis suggests that since each company produces a specific product or offers a specific service, it is possible that a specific indicator data will be determined. This was not covered by the existing questionnaire. Thus, financial and non-financial performance measures given in the questionnaire were, for the most part, not used for measurement. An overview of the KPIs in the functional area of production control is presented below:
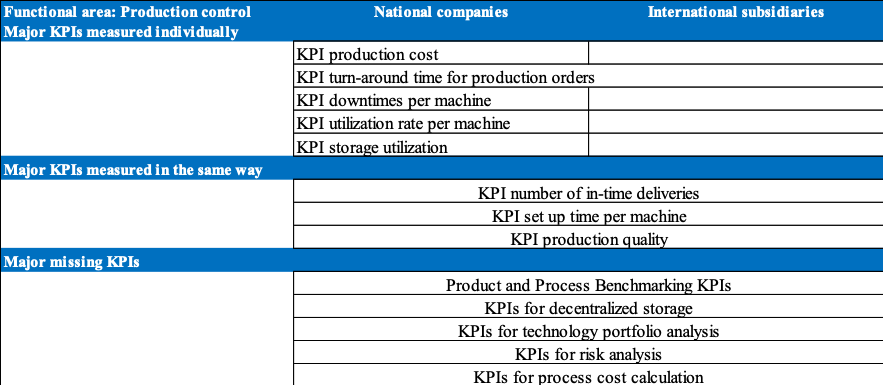
Table 5. Major indicators of the functional area production control
3.2.4 Management reporting sales control
The present research revealed that KPIs for price calculation in sales control are not available. This is surprising because prices are after all the most important result of the sales control department. However, as expected, financial performance measures were mainly consulted in national companies as they can be measured in time. These are distribution costs (planned, actual, forecast), distribution cost in relation to sales, distribution costs per field staff and average receivables in kEUR.
Furthermore, revenues per market segment and customers, the contribution margin and the profit margin are measured as financial performance measures. The most important performance measures in national companies are revenue, contribution margin and profit margin. These are 100% measured in national companies.
Also, dominant in national companies are the non-financial KPIs like general performance measures for market analysis, product results analysis and customer satisfaction analysis (Vargo and Lusch, 2004). Customer retention analysis key data and KPIs for break-even-analysis, day sales outstanding (although a global use of the key indicators was expected here), number of existing and new customers and key indicators for the capacity planning were measured mainly in national companies.
The following performance measures were calculated in international companies: sales, contribution margin and profit margin, with a score above 81% used for the assessment. Not evident were other performance indicators used in sales control, which occur particularly in reports of international companies.
Sales performance measures that were similarly measured at the national and international level were non-existent.
Just like financial performance measures, non-financial performance measures are applied mainly in national companies. Two performance measures were of great importance in national companies, namely; the number of existing customers and the number of new customers – both accounting to 90% and 100% respectively. Their importance in international companies lies with a score of approximately 72% slightly lower.
Financial performance measures such as distribution costs (plan, actual, forecast), distribution costs in relation to sales, cost of sales per sale representative and average accounts receivable in kEUR, revenues, gross and profit margin were specifically determined in national companies, since these data is saved locally and is therefore easily available (Atkinson et al., 2012). International comparability should be created, for example, the comparison of sales of customer A between Germany and the United States, which often is not the case in reality.
One reason why non-financial performance measures are mainly measured in national companies could be because of the role played by fast operative impact and the direct possibility of influence at the national level (Van Der Stede, Chow and Lin, 2006, Hall 2008). It is possible that a comparability between the KPIs of the national company and international subsidiaries cannot be realized, for example, the number of existing customers cannot be used since this data is collected differently and in different systems. Thus, these key figures are not applied in the international subsidiaries as seen also in table 6.
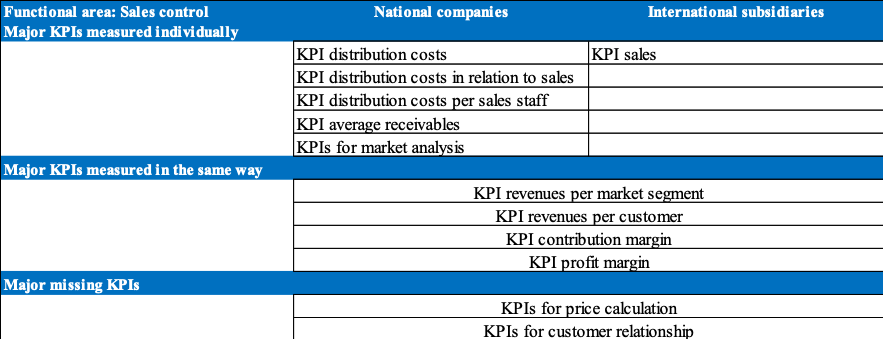
Table 6. Major indicators of the functional area sales control
3.3. Cost accounting and calculation
The following KPI is not measured in cost accounting and calculation – shortage costs. It probably involves a logistics specific and process indicator that the surveyed companies did take into account.
However, financial performance measures were consulted in national companies. This is typical for German companies as in the area of cost accounting and calculation nearly all measures employed have a financial background. In the same time, in national companies different non-financial performance measures were also used. Financial performance measures in the functional area cost accounting and calculation include customer success, market segment success, product success, absolute and relative contribution margin, fixed and variable costs, single and overhead costs, plan, actual and target costs, cost category, costs of cost centers and costs of cost units as well as deviation (actual, plan, target).
Other functional costs that are used are write-offs, procurement costs, job planning costs, transport costs, inventory difference, reclamation costs, quality assurance costs and costs for trainings and seminars. The cost increase rate in % is often given in the form of inflation and is therefore increasingly measured at the national level. Due to the fact that operational data such as orders are measured especially in national companies, the costs per order is used as a financial KPI.
Non-financial performance measures also predominantly emerge in the cost accounting and calculation in national companies (Adler, Everett and Waldron, 2000). These are centralized and decentralized booking deadlines (in working days), internal cost allocation (intra, inter and intercompany) (in working days), quotation rates, order rates, reclamation rate in % and capacity.
Some financial performance measures are also used in international companies, in particular: product success, absolute contribution, plan costs, actual costs, deviation (actual, plan, target), as well as write-offs, personnel and procurement costs.
Other control parameters in cost accounting and calculation that occur particularly in reports of international companies are not used.
Only the costs of the customer order processing are present with 55% both in national and international companies. Just like financial performance measures, non-financial performance measures are applied mainly in national companies. The most important figures here are the decentralized and centralized booking deadlines, internal cost allocation as well as order rates and reclamation rates.
Financial performance measures that illustrate costs and have the above mentioned details are typical in German companies. Therefore, it is not surprising that typical German indicators such as profit margin especially in national companies are not only present to 100%, but are also used by their subsidiaries at an 82% rate.
It is possible that the KPIs of the national company and international subsidiaries cannot be compared. For example, the reclamation rate that fall under other reclamation cannot be used standardized since this data is collected using different systems. Therefore, such indicators are hardly used internationally. Table 7 gives a brief account of the situation in the functional area of cost accounting and calculation.
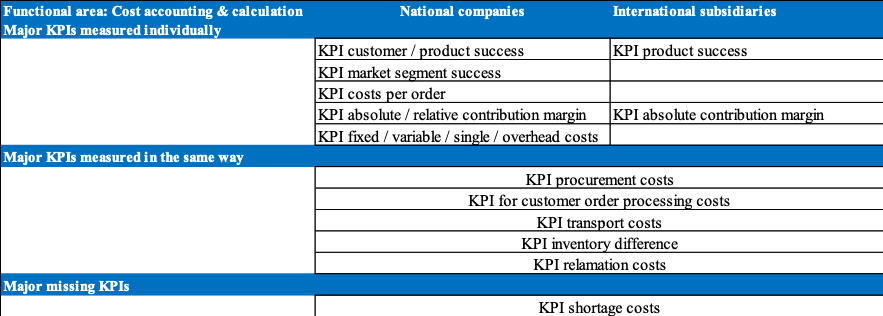
Table 7. Major indicators of the functional area cost accounting and calculation
3.4. Project and investment control
The following KPIs in project and investment control are not measured: KPIs of static cost comparison calculation and profit comparative calculation, KPIs of process cost calculation, key figures for efficiency analysis, extent of utilization ratio and error rate in the project (in %) as well as the degree of completion of the project in %, the average duration of the investment decision in working days and the variation in quality of the investment projects. These KPIs are considered though in the survey by both national and international companies as important.
However, financial performance measures were consulted in national companies. These are IT-costs, maintenance cost, investment volume, KPIs of static amortization calculation, KPIs of static profitability, KPIs of the capital value method, KPIs of the internal rate of return method, KPIs of the cost-benefit analysis, KPI of project costing and KPIs of the project costs (internal, external).
Non-financial performance measures also predominantly emerge particularly in national companies. Number of investment objects, cost variance of investment objects, time deviation of investment objects (however, a quality deviation of investment objects is not measured). In addition, non-financial performance measures such as capacity planning, project status reports and timeliness of projects are used mainly in national companies.
The financial performance measures IT-costs and external project costs are particularly used in international companies. Further control indicators in project and investment control that arise particularly in reports of international companies were not evident.
The following key indicators are equally found in national and international companies: KPIs of the balanced scorecard and the project completion rate. These performance measures are considered global control instruments (De Geuser, Mooraj and Oyon, 2009).
Just like financial performance measures, non-financial performance measures are applied mainly in national companies. The number and the cost variance of the investment projects, the project status reports, the timeliness of projects (%) and the capacity planning of project resources play a crucial role.
Financial performance measures that illustrate investment costs are typically noted only in national companies. It is surprising that the static procedures (which are usually easy to use) are not used at all (cost comparison calculation or profit comparative calculation), yet dynamic investment computing procedures dominate nationally. As expected, an instrument such as the balanced scorecard which is equipped with financial and non-financial KPIs is used nationally and internationally since its simplicity largely allows international transferability (Davis and Albright, 2004). The project conclusion ratio can be also regarded as simple and is therefore used at the national and international level.
Non-financial performance measures are frequently not taken into consideration since they are deemed as too unusual in this area. Some examples are average duration of the investment decision in working days or quality difference of investment projects. The KPIs used or neglected by the surveyed companies are presented in table 8.

Table 8. Major indicators of the functional area project and investment control
3.5. Company and shareholding control
The following financial KPIs are not measured in company and shareholding control: KPIs according to US-GAAP (this applies to both the individual as well as the consolidated financial statements), KPIs for the balanced scorecard for shareholding (although in the questionnaire the instrument of the balanced scorecard was described as international), KPIs for the contribution margin accounting for shareholding, value proposition for shareholding, KPIs of process cost accounting for shareholding. In addition, non-financial KPIs such as the page count of the monthly reports on operational, financial and strategic shareholding, the shareholding’s resources and the key figures of the capacity planning are not measured. Furthermore, the KPIs for risks of investments remain side-lined during the measurement.
Most financial performance measures in company and shareholding control were, as expected, mostly measured in national companies because they can be easily measured in time. According to the German Commercial Code (HGB) these are KPIs for individual and consolidated financial statements, KPIs for the balance sheet and consolidated income statements of shareholding and personnel key indicators (capacities) for shareholding. In addition, the following KPIs are measured particularly in national companies: the debt ratio, fixed and current assets as well as equity and liabilities.
Other non-financial performance measures that occur mainly in national companies are: the number of operational, financial and strategic shareholding and the number of shareholding projects.
Performance indicators that are mainly present in international companies are KPIs according to international financial reporting standards (IFRS) for the individual and consolidated financial statements and KPIs for fixed assets, non-current assets, equity and liabilities, each measuring 64%.
Yet, there were no indicators in national and international companies having the same percentage especially in company and shareholding control. Often the area company and shareholding control is one department in an enterprise so that performance measures for the national parent company and the international subsidiary are often measured in the same way.
Non-financial performance measures are often not available or, just like the financial performance measures, they are used mainly in national companies. The non-financial performance measures are mainly indicators used in operational, strategic and financial investments.
The questionnaire did not distinguish between financial control in the parent company and its subsidiaries; this part of the study chiefly displays financial control of subsidiaries. The data gathered in a previous statement of the questionnaire confirmed that innovative key indicators of the balanced scorecard or the process cost calculation, which are not even measured consistently in national companies, are certainly not available internationally, thus, mostly non-existent in the subsidiaries. Predominant are, as it can be seen in table 9, traditional financial and consolidated income statement and proven KPIs like debt ratio, fixed assets, non-current assets as well as equity and liabilities, which can easily be calculated from the balance sheet and consolidated income statement.
Non-financial performance measures are often not measured because they are deemed as too unusual.
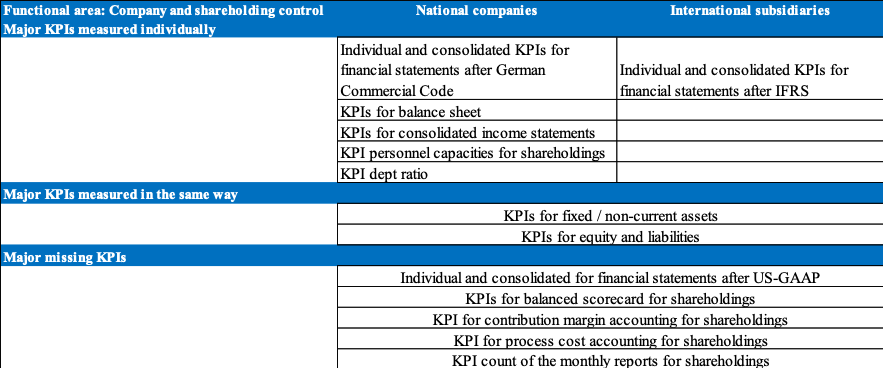
Table 9. Major indicator of the functional area company and shareholding control.
4. Measurement of process orientated performance measures
During the evaluation of the study it became obvious that seven performance measures (out of 10 innovative performance measures that can be seen in figure 3) were mostly measured in national companies. Moreover, key indicators in the international subsidiaries were either omitted or used less frequently. The following illustrations of the functional area strategic and operational planning for national and international companies show these results as a showcase for all other areas:
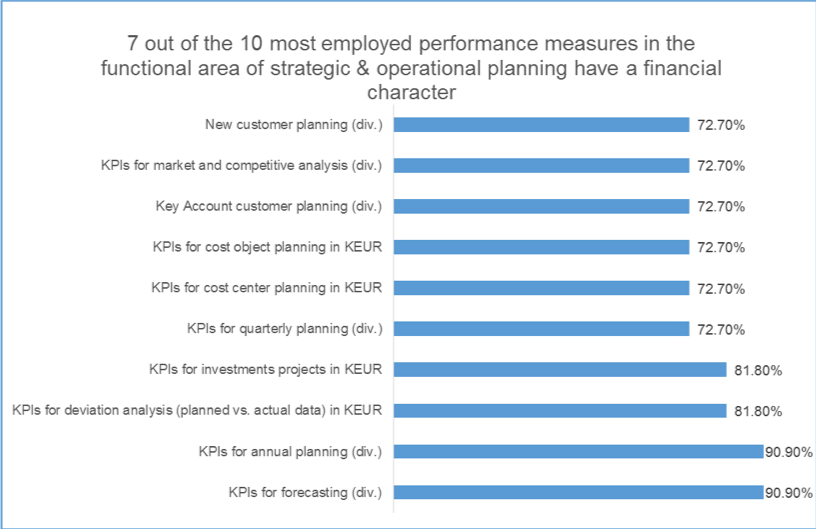
Figure 3. Performance measures in the functional area strategic & operational planning in national companies.

Figure 4. Performance measures in the functional area strategic & operational planning in international companies.
In addition, it was important to find out which performance measures are not measured in national and international companies in financial control. This possibly calls for the following measures; firstly, a clear definition of these key figures in many companies should be set and, secondly, these performance measure should be made measurable using existing systems. The following illustrations (no. 5 and 6) show 10 most frequently unmeasured financial and non-financial performance measures in national and international companies:
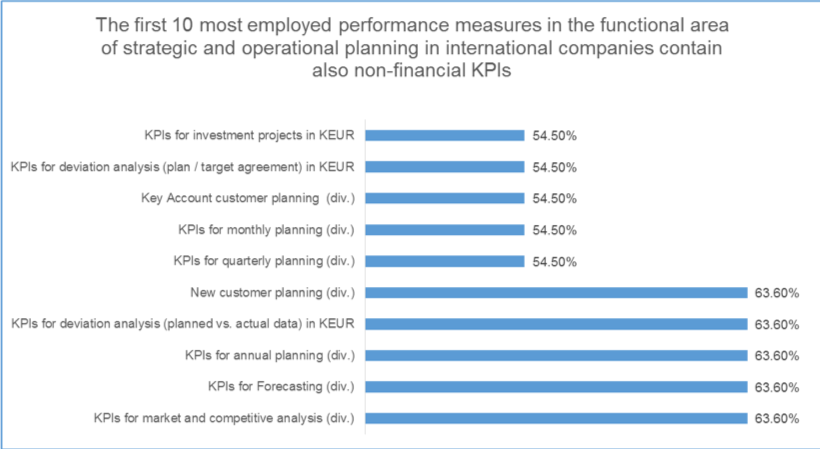
Figure 5. The 10 performance measures in functional area strategic & operational planning in national companies that are hardly used or not used at all.
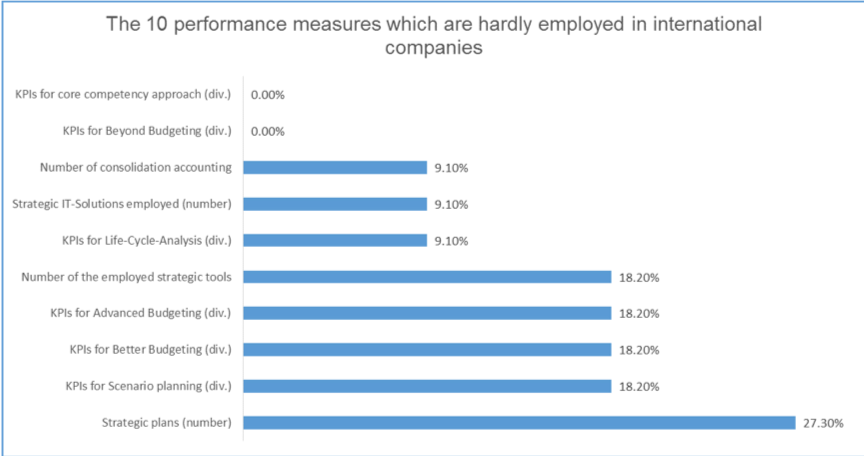
Figure 6. The 10 performance measures in functional area strategic & operational planning in international companies that are hardly used or not used at all.
Overall, the following performance measures were recorded in the questionnaire:
- Key indicators/KPIs total: 242
- Financial process performance measures – total: 156
- Non-financial process performance measures – total: 86
- Process orientated control indicators – specific: 127
- Non-process oriented control indicators – specific: 115
127 process orientated performance measures were established which were characterized by a non-financial database and a comprehensive process orientation in the cross section function of a company, since one main focus of the research laid in the field of process orientation. It was surprising that process orientated indicators were frequently not measured and most companies wished they could do so by proving process management with the help of process orientated indicators. Furthermore, in all functional areas, except for the area sales control, the financial key indicators outweighed non-financial ones.
This shows, particularly with process-oriented indicators, that companies need further consultancy so as to define these performance measures and to outline their use. This general impression that KPIs are predominantly measured in national companies could also be confirmed by the survey for process orientated indicators. But even in national companies, process orientated performance measures were incomplete and were only shown upon request. In sales control process oriented indicators were mostly used. Of the 17 performance measures more than half (11) were process oriented and 6 purely financially as the following illustration shows:
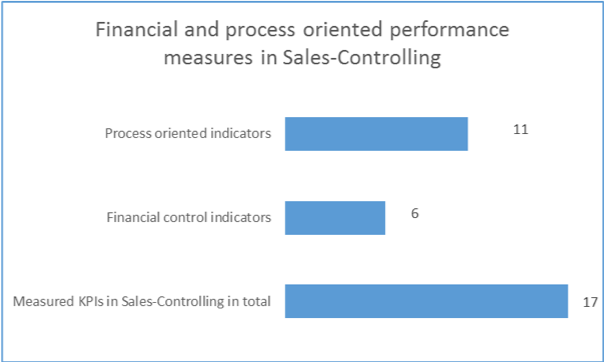
Figure 7. Number of financial and process orientated key indicators.
5. Conclusion
The overall result of the study can be summarized in five points:
- Five key performance indicators: EBIT (operating profit), cash flow, shareholder value (EVA), annual planning (operating profit), IFRS (financial statements, operating earnings) were employed for financial control in all companies both at the national and international level. Essentially, it became obvious that there is need for further research and consulting pertaining the practical use of process orientated performance measures.
- KPIs for core competency approach, innovative KPIs scenario techniques, the life cycle analysis, the better, advanced and beyond budgeting are non-existent in most companies. This is surprising because in literature these concepts are mentioned as innovative and often used. Most companies state that they have no key indicators for value analysis, target costing for value based management and risk management (although these instruments have the highest percentage for use internationally). Examples of key indicators that are hardly measured are: cash flow/employee and shareholder value as well as R&D applications and other non-financial functional key indicators. Furthermore, utilization rates and KPIs of process cost calculation are often not used. It is clear that the use of innovative instruments is aspired by many companies, but the practical application in most companies is still missing.
- As expected, the following indicators are present in national companies: planning data (continuous planning, forecast, for quarterly and monthly planning and for deviation analysis) as well as KPIs of information on cost type, cost center and cost unit. The reason is that especially in German companies detailed performance measures are used. Also measured in national companies are process and benchmarking indicators. It is not surprising that, above all, EBIT, sales and return numbers are used in national companies because they are exactly measurable in time. As expected, particularly functional costs such as R&D costs are measured in the corresponding functional control areas like R&D control, logistics control, production control and sales control.
- In national and international companies early warning systems, the SWOT analysis and the balanced scorecard are in use because these instruments are often applied internationally. They also make up a large part of the non-financial measures particularly in financial control.
- It is striking that international companies have no special reports for special indicators (exception: KPI time to market in working days). This suggests that international companies use national control indicators. Thus, from the financial control point of view, performance measurements and performance management should not be considered separately since their control measures are similar.
The results of the survey were based on German parent companies and their international subsidiaries, who participated in the study. The findings of this study suggest that there is need for further research. For instance, the next step could be based on this survey; parent companies could be surveyed in order to identify their needs for different performance measures to be used in financial control within the management of KPIs.
References
Adams, R., Bessant, J. and Phelps, R. (2006). Innovation Management Measurement: a review. International Journal of Management Reviews, 8, pp. 21-47.
Adler, R., Everett, A.M. and Waldron, M. (2000). Advanced Management Accounting Techniques in Manufacturing: Utilization, Benefits and Barriers to Implementation. Accounting Forum, 24(2), pp. 131-150.
Atkinson, A.A., Kaplan, R.S., Matsumura, E.M. and Young, S.M. (2012). Management Accounting: Information for Decision-Making and Strategy Execution. 6th ed. New Jersey: Pearson Education.
Aureli, S. (2010). “The Introduction of Innovative Performance Measurement and Management Control Systems: the Role of Financial Investors and Their Acquired Companies,” in Epstein, M.I., Manzoni, J.-F. and Daviala, A. (Eds.), Performance Measurement and Management Control: Innovative Concepts and Practices, Bingley: Emerald Group Publishing.
Binder, B.C.K. (2003). Prozessorientiertes Performance Measurement: Einführung und Anwendung in der Telekommunikationsbranche. Springer, Wiesbaden.
Bititci, M., Garengo, P., Dörfler, V., Nudurupati, S. (2012). Performance Measurement: Challenges for Tomorrow. International Journal of Management Reviews, 14, 305-327.
Bourne, M., Mills, J., Wilcox, M., Neely, A. and Platts, K. (2000). Designing, Implementing and Updating Performance Measurement Systems. International Journal of Operations and Production Management, 20, pp. 754-771.
Bourne, M. (2001). The Handbook of Performance Measurement. London: Gee Publishing.
Bourne, M., Neely, A., Mills, J. and Platts, K. (2003). Implementing Performance Measurement Systems: a Literature Review. International Journal of Business Performance Management, 5(1), pp. 1-24.
Chan, F.T.S. and QI, H.J. (2003). An Innovative Performance Measurement Method for Supply Chain Management. Supply Chain Management: An International Journal, 8, pp. 209-223.
Chow, C.W. and Van Der Stede, W.A. (2006). The Use and Usefulness of Nonfinancial Performance Measures, Management Accounting Quarterly, 7(3), pp. 1-8.
Davis, S. and Albright, T. (2004). An Investigation of the Effect of Balanced Scorecard Implementation on Financial Performance. Management Accounting Research, 15(2), pp. 135-153.
De Geuser,F., Mooraj, S. and Oyon, D. (2009). Does the Balanced Scorecard Add Value? Empirical Evidence on Its Effect on Performance. European Accounting Review, 18(1), pp. 93-122.
Demartini, C. (2014). Performance Measurement Systems: Design, Diagnosis and Use. Springer, Berlin Heidelberg.
De Toni, A.F. and Tonchia, S. (2001). Performance Measurement System – Models, Characteristics and Measures. International Journal of Operations and Production Management, 21, pp. 46-70.
De Vries, H. and Margaret, J. (2003). The Development of a Model to Assess the Strategic Management Capability of Small and Medium-Size Businesses. Journal of American Academy of Business, 3, pp. 85-92.
Fitzgerald, L. (2007). “Performance Measurement” in Hooper, T., Northcott, D. and Scapens, R. (Eds.), Issues in Management Accounting, 3rd ed., Essex: Pearson Education, pp. 223-241.
Folan, P. and Browne, J. (2005). A review of Performance Measurement: Towards Performance Management. Computers in Industry, 56, pp. 663-680.
Franco-Santos, M. et al. (2007). Towards a Definition of a Business Performance Measurement System. International Journal of Operations and Production Management, 27, pp. 784-801.
Gladen, W. (2008). Performance Measurement: Controlling mit Kennzahlen. 4th Ed. Springer,Wiesbaden.
Gleich, R. (2011). Performance Measurement: Konzepte, Fallstudien und Grundschema für die Praxis. 2nd Ed. Springer, München.
Hall, M. (2008). The Effect of Comprehensive Performance Measurement Systems on Role Clarity, Psychological Empowerment and Managerial Performance. Accounting, Organizations and Society, 33(2), pp. 141-163.
Hoque, Z. and James, W. (2000). Linking Balance Score-Card Measures to size and Market Factors: Impact on Organizational Performance. Journal of Management Accounting Research, 12, pp. 1-17.
Jusoh, R., Ibrahim, D.N. and Zainuddin, Y. (2008). The Performance Consequence of Multiple Performance Measures Usage: Evidence from the Malaysian Manufactures. International Journal of Productivity and Performance Measurement, 57(2), pp. 119-136.
Kaplan, R.S. and Norton, D.P. (2001). The Strategy-Focused Organization. Boston: Harvard Business School Press.
Kennerley, M. and Neely, A. (2003). Measuring Performance in Changing Business Environment. International Journal of Operations and Production Management, 23, pp. 213-229.
Krause, O. (2006). Performance Management – Eine Stakeholder-Nutzen-orientierte und Geschäftsprozessbasierte Methode. Springer, Wiesbaden.
Lehtinen, J. and Ahola, T. (2010). Is Performance Measurement Suitable for an Extended Enterprise? International Journal of Operations and Production Management, 30, pp. 181-204.
Martín de Castro, G., Delgado-Verde, M., López-Sáez, P., Navas-López, J.E. (2011). Towards ‘an Intellectual Capital-Based View of the Firm’: Origins and Nature. Journal of Business Ethics. 98 (4). Springer: 649-662.
Neely, A. and Adams, C. (2001). The Performance Prism Perspective. Journal of Cost Management, 15, pp. 7-15.
Neely, A. (2005). The Evolution of Performance Measurement Research – Developments in the Last Decade and a Research Agenda for the Next. International Journal of Operations and Production Management, 25, pp. 1264-1277.
Otley, D. (2007). “Accounting Performance Measurement: a review of its Purposes and Practices” in Neely, A. (Ed.), Business Performance Measurement: Unifying Theories and Integrating Practice, 2nd ed., New York: Cambridge University Press.
Purbey, S., Mukherjee, K. and Bhar, C. (2007). Performance Measurement System for Health Care Processes. International Journal of Productivity and Performance Management, 56, pp. 241-251.
Richard, P.J., Devinney, T.M., Yip, G.S., Johnson, G. (2009). Measuring Organisational Performance: Towards Methodological Best Practice. Journal of Management, 35, pp. 718-804.
Taticchi, P., Tonelli, F., Cagnazzo, L. (2010). Performance Measurement and Management: a Literature Review and a Research Agenda. Measuring Business Excellence, 14, pp. 4-18.
Tsai, W.H. and Hung, S.J. (2009). A Fuzzy Goal Programming Approach for Green Supply Chain Optimisation under Activity-Based Costing and Performance Evaluation with a Value Chain Structure. International Journal of Production Research, 47, pp. 4991-5017.
Van Der Stede, W.A., Chow, C.W. and Lin, T.W. (2006). Strategy Choice of Performance Measures and Performance. Behavioural Research in Accounting, 18, pp. 185-205.
Vargo, S.L. and Lusch, R.F. (2004). Evolving to a New Dominant, Logic for Marketing. Journal for Marketing, 68, pp. 1-17.
Williams, D.W. (2002). Before Performance Measurement. Administrative Theory and Practice, 24, pp. 457-486.